this post was submitted on 22 Dec 2024
77 points (86.7% liked)
Map Enthusiasts
4970 readers
28 users here now
For the map enthused!
Rules:
-
post relevant content: interesting, informative, and/or pretty maps
-
be nice
founded 2 years ago
MODERATORS
you are viewing a single comment's thread
view the rest of the comments
view the rest of the comments
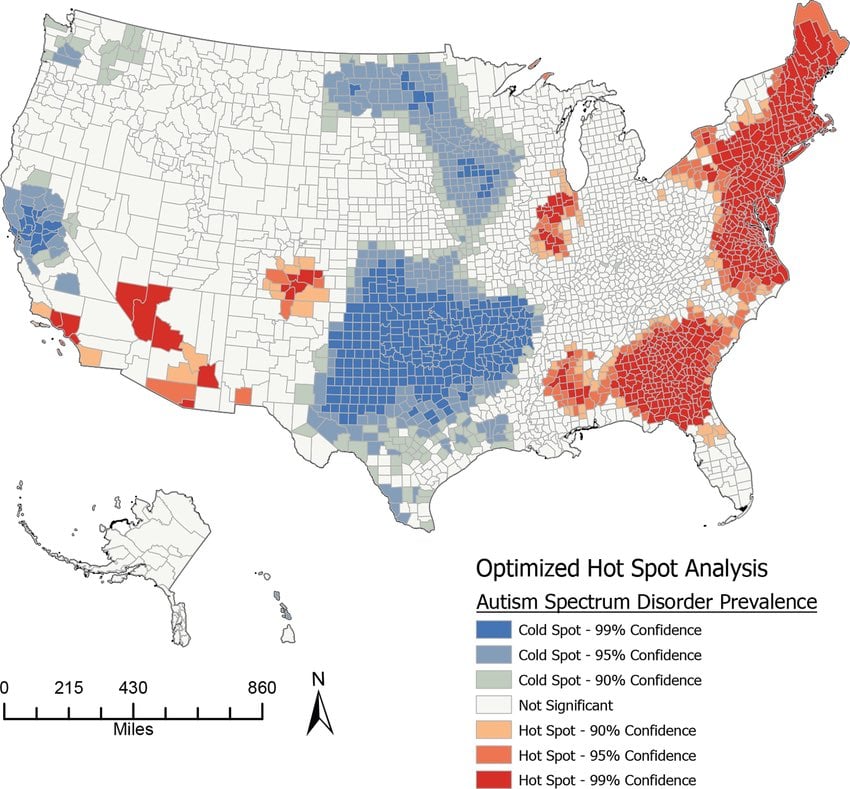
One can interpret the maps as: Rural children are diagnosed less than children in large cities
I don't know, a lot of the red is over pretty rural areas in the south and parts of the southwest, and the majority of the most rural parts of the country are "not significant".
Also that big blue part in the middle covers some very large cities.
All kinds of medical regulation, financing etc. could lead to differences like this.