101
Data Is Beautiful
6847 readers
1 users here now
A place to share and discuss data visualizations. #dataviz
(under new moderation as of 2024-01, please let me know if there are any changes you want to see!)
founded 4 years ago
MODERATORS
102

104
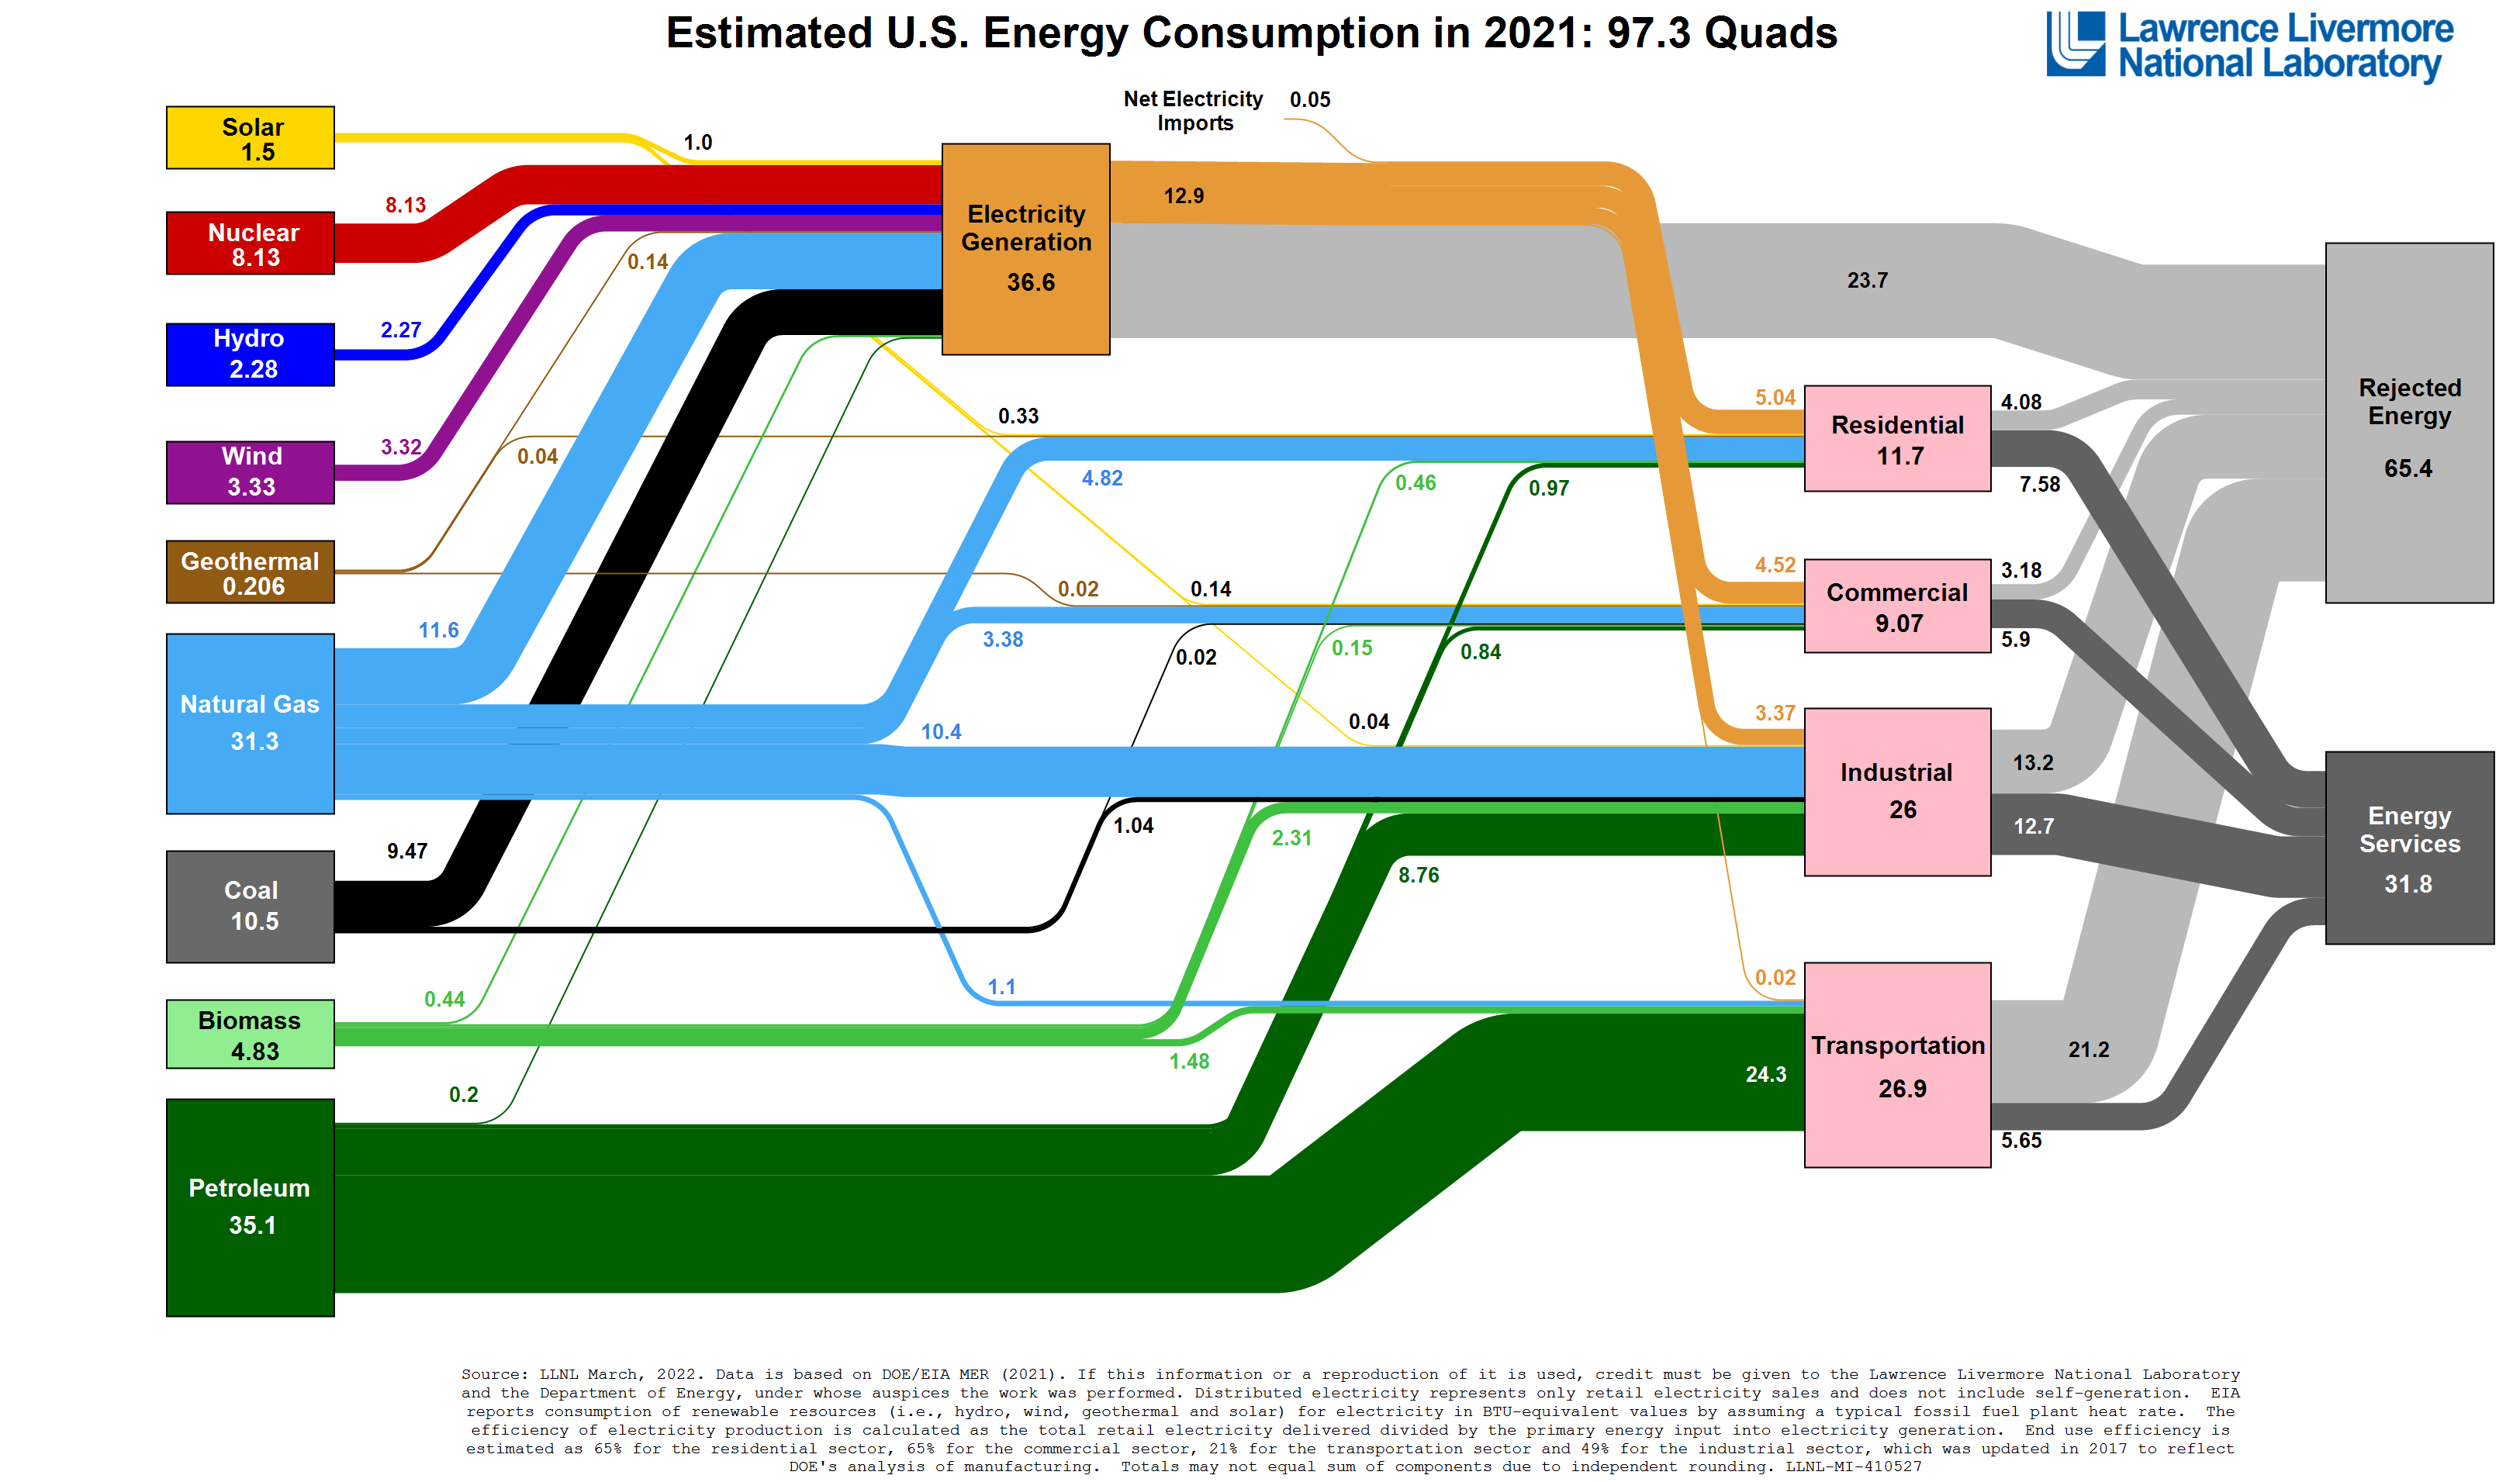
It is certainly not perfect, but still an impressive piece of work.
And here is a version embedded in a web page so it scales to your browser window's width.
105


111
113
114
Image Transcription (Courtesy of @Transcriptionist@lemmy.world) :
A picture of the character Data from the Star Trek series.

115
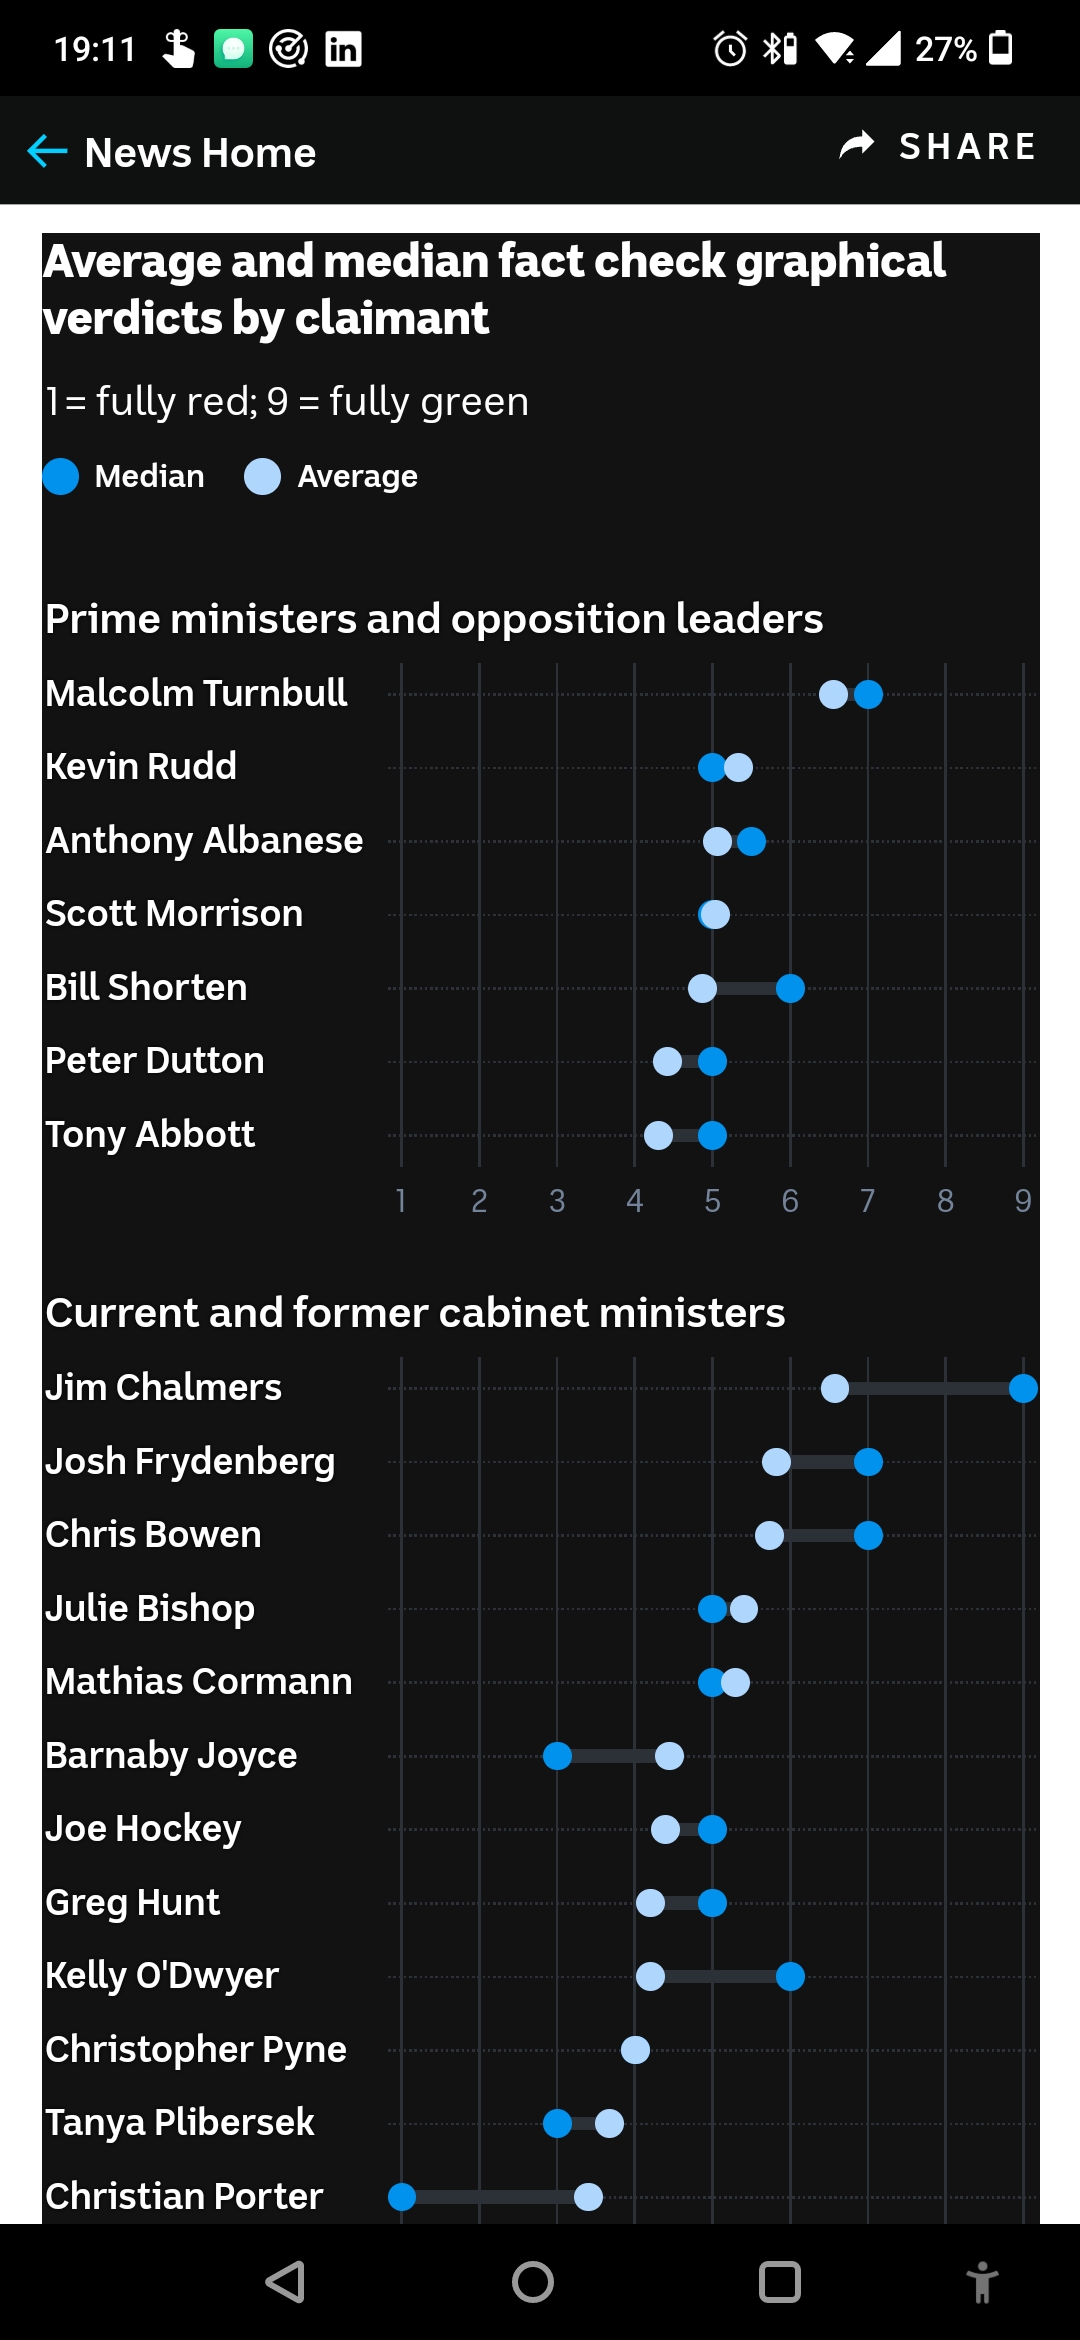
Source https://www.abc.net.au/news/2023-08-17/fact-check-fact-check-10-year-anniversary/102738260
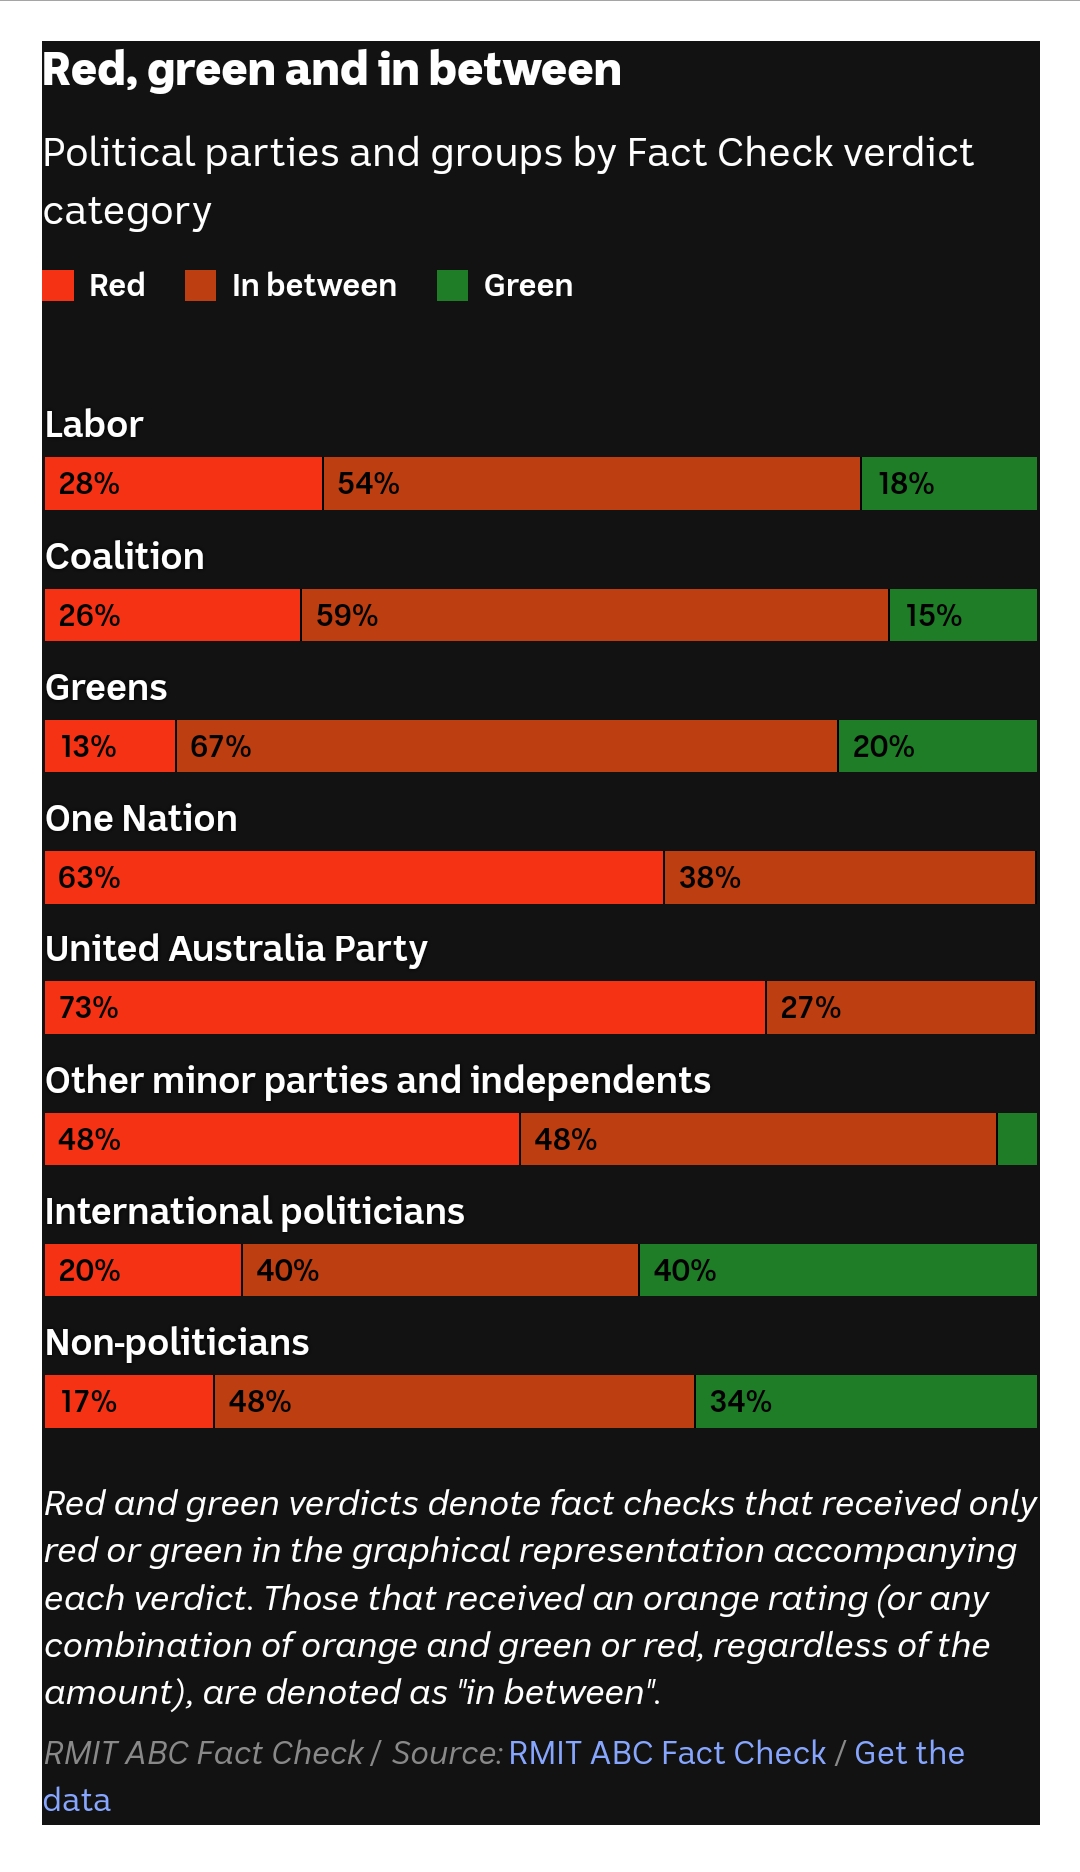
Another good one
116
118
56
[OC] COVID-19 was the cause of 1 out of every 9.7 deaths in the US in 2020 (Infographic)
(i.redd.it)
cross-posted from: https://lemmit.online/post/356966
This is an automated archive made by the Lemmit Bot.
The original was posted on /r/dataisbeautiful by /u/ChemicalAd5153 on 2023-08-01 11:05:30.

121
energy-charts.info provides a great overview over electricity generation by sector, renewable share and a lot of other data on the German electricity network. They also provide estimates for the next few hours and scenarios how the electricity network could look like in a few decades.

124
125
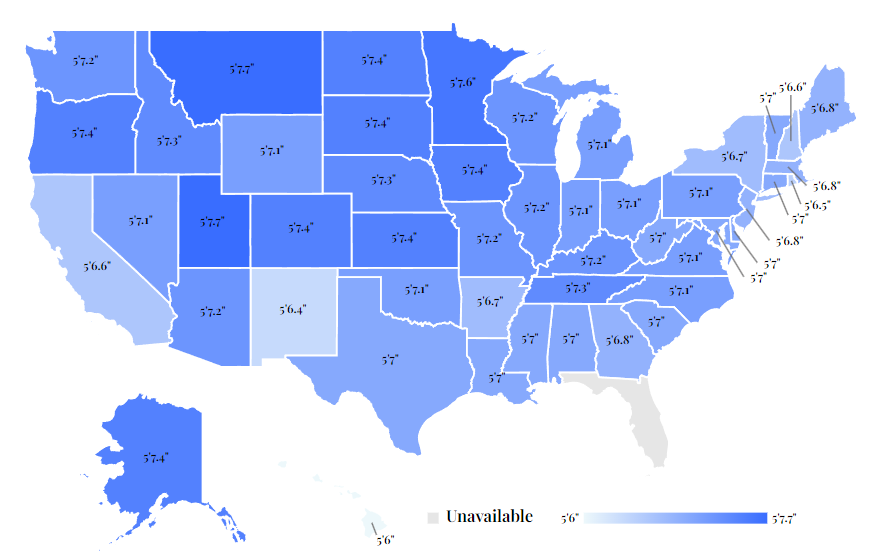
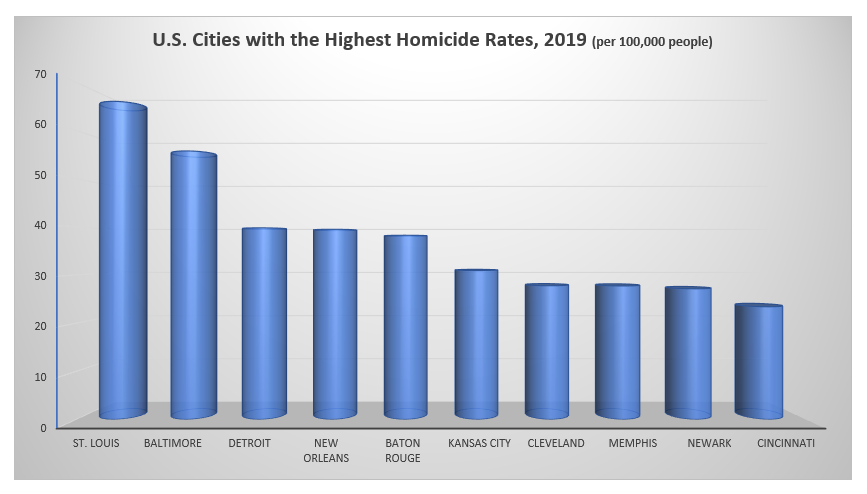
Source: Purdue University Dept of Sociology
